.png)


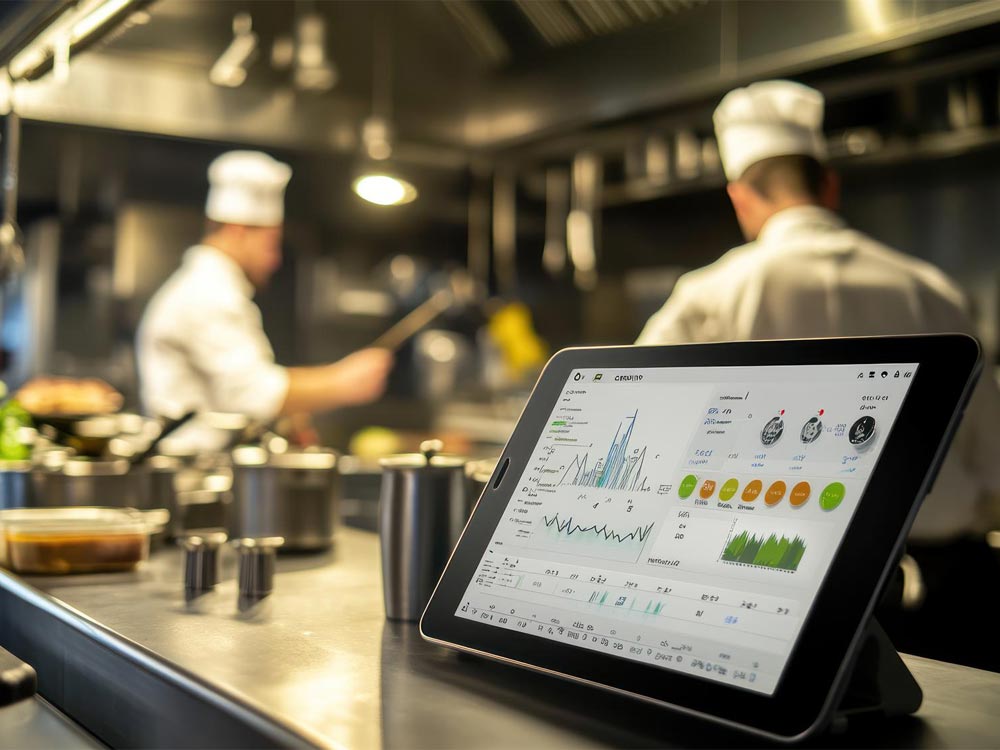
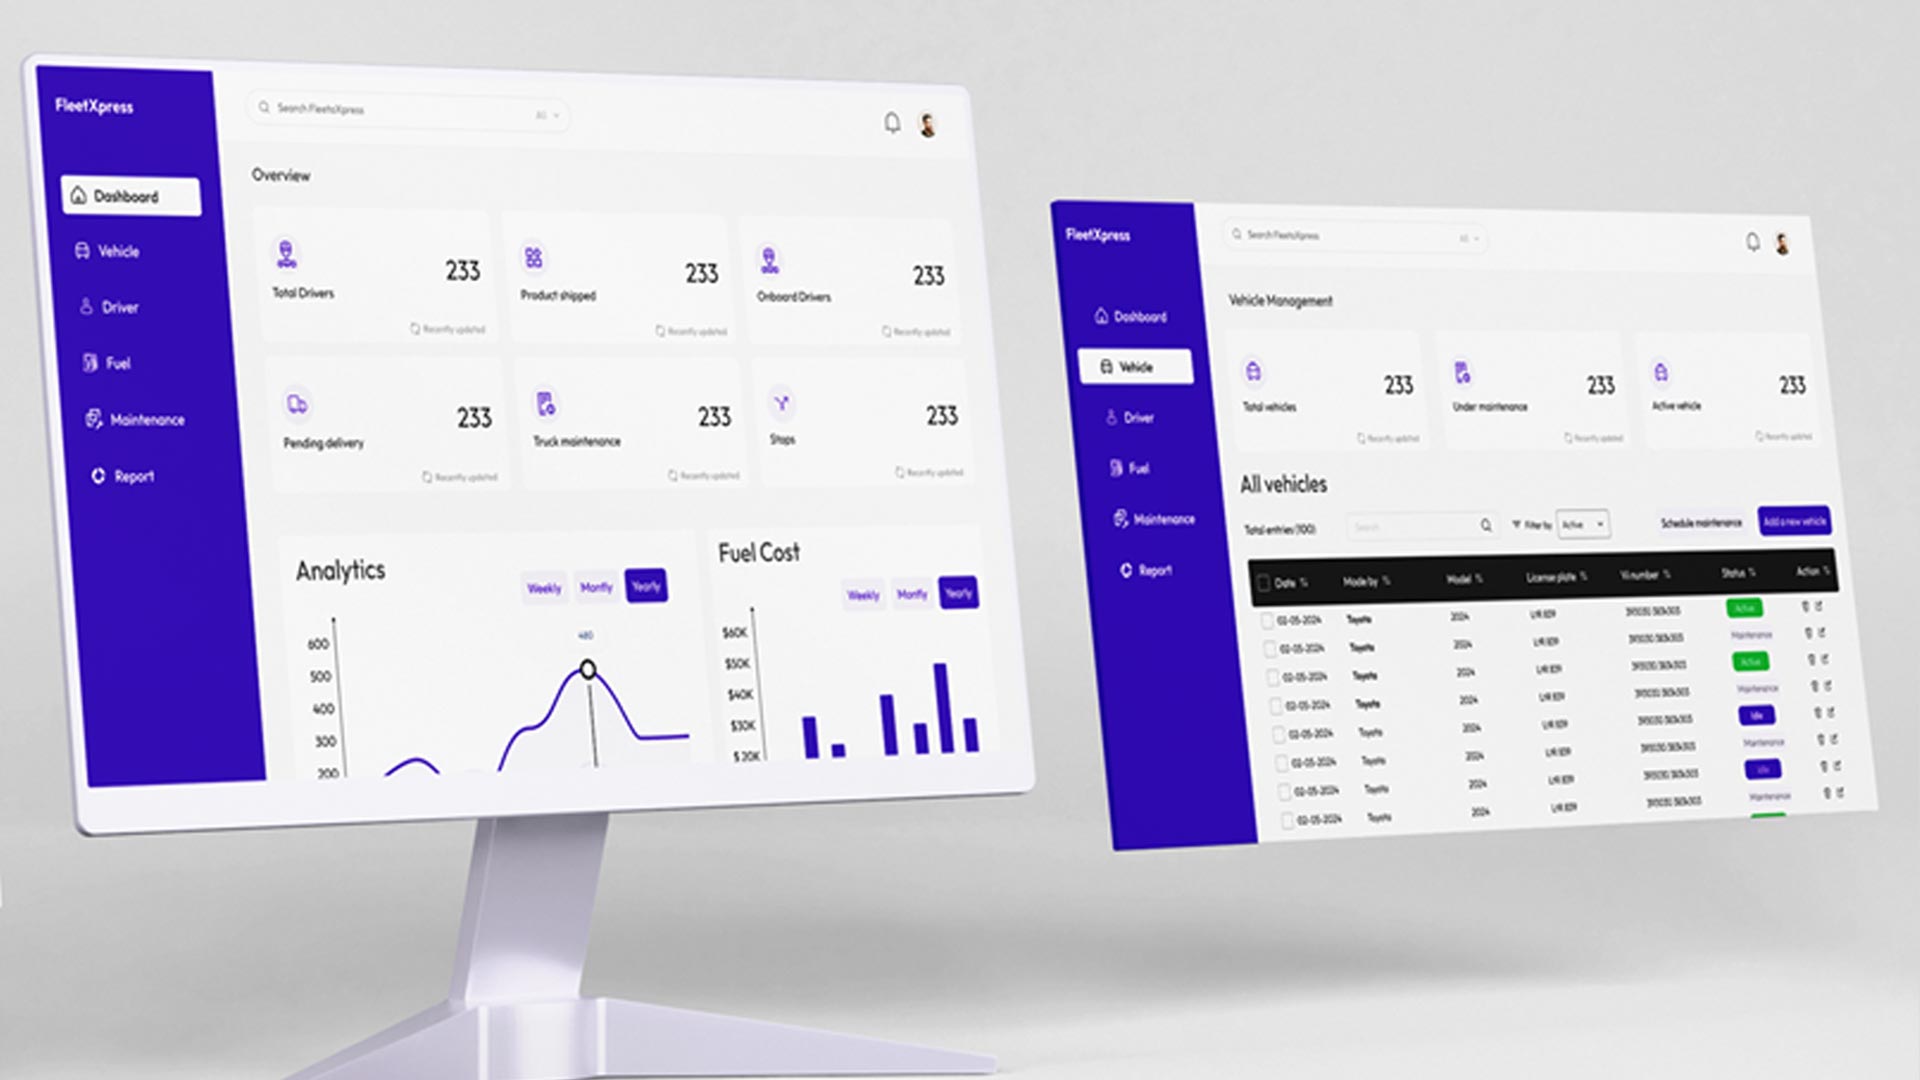
In fleet logistics, data visualization is one of the critical aspects for transforming raw data into actionable insights. These insights assist fleet managers in making well-informed decisions that contribute towards improving operational efficiency.
Here we have highlighted certain reasons on why data visualization is essential in fleet logistics:
1. Real-Time Monitoring and Fleet Tracking
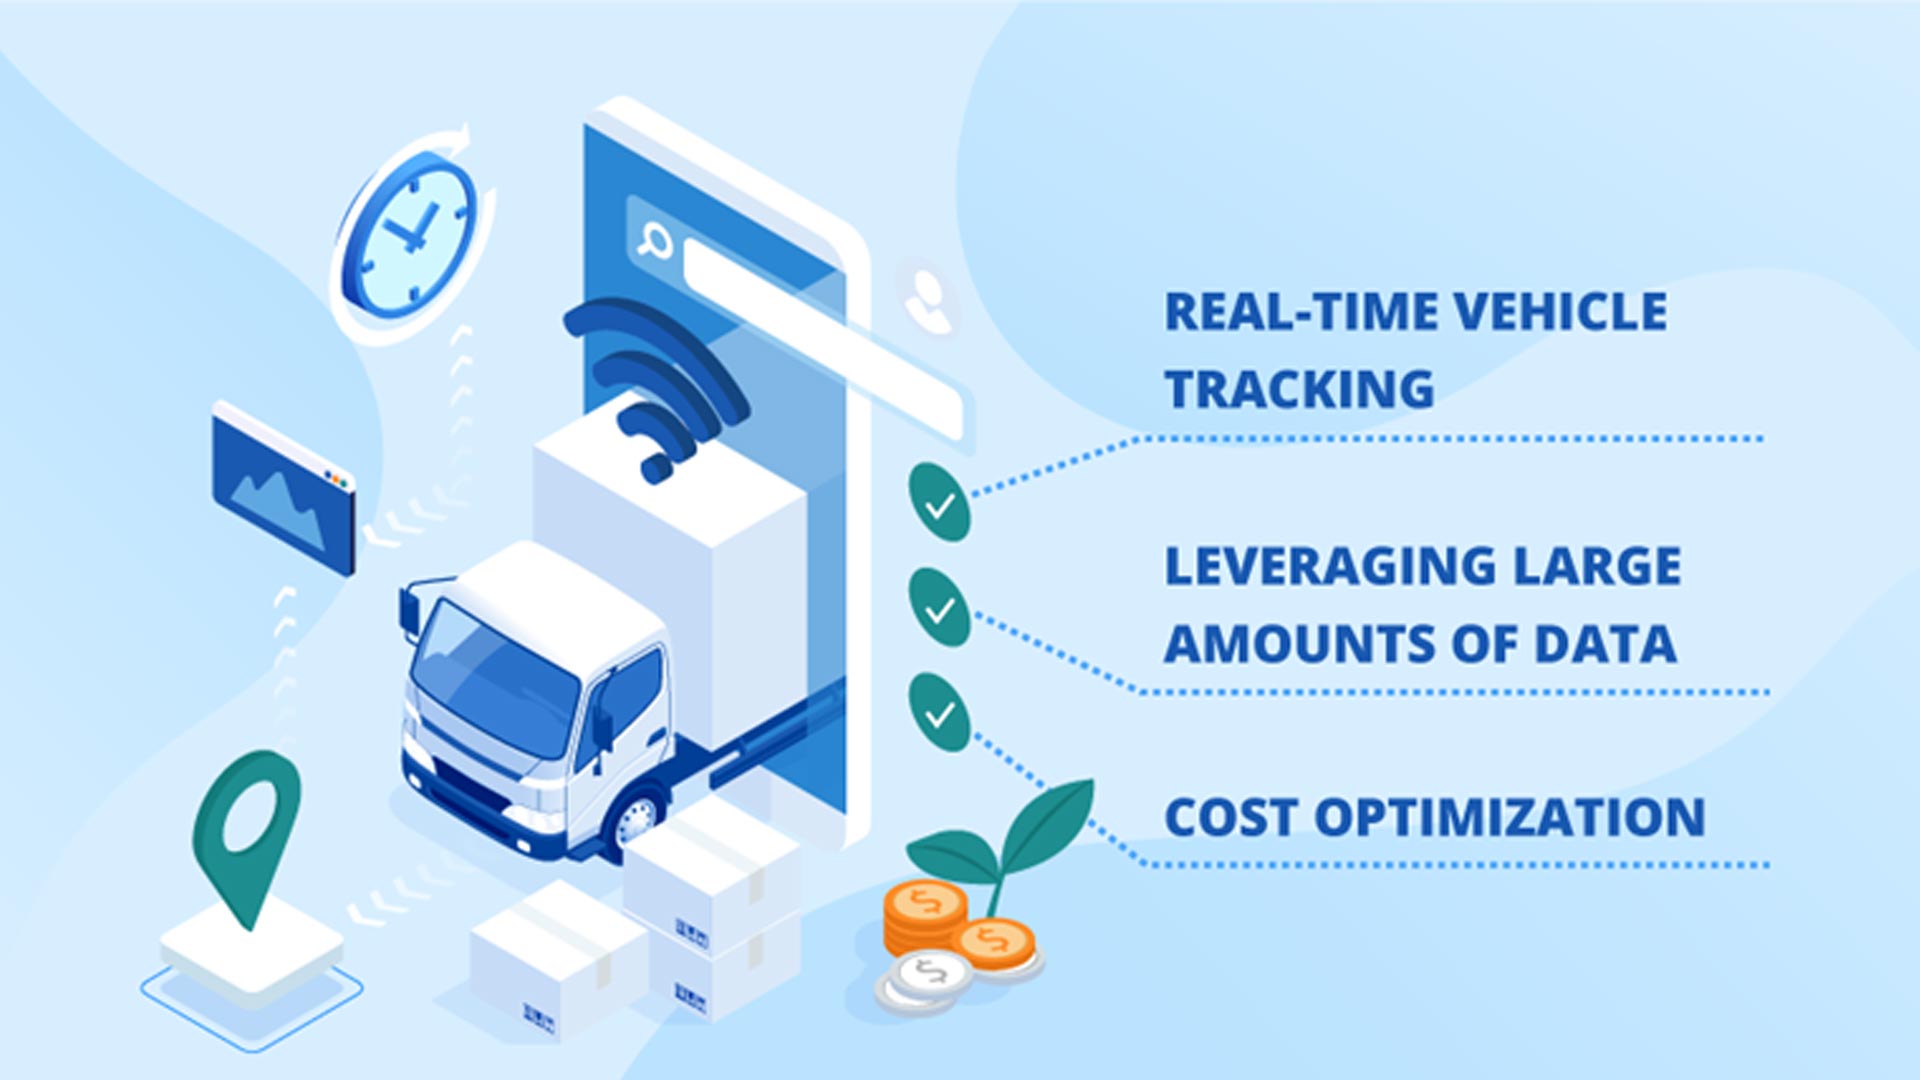
The data visualization tools enable the fleet managers to track vehicles in real-time via live maps and dashboards.Through these visualizations, you can monitor:
- Vehicle location: The GPS- enabled maps displays the position of vehicle, which provides better monitoring and route management.
- Driver behavior: It helps us identify incompetencies by visualizing idle times, speed, fuel consumption and other driving habits. This feature encourages compliant with safety regulations.
- ETA (Estimated Time of Arrival): Based on the current position of the vehicle, ETA promotes better communication and coordination with the distribution centers and clients.
This results in:
- Better delivery times and improved route planning.
- Reduced fuel consumption and less idle time.
- Improved driver safety via behavior monitoring.
2. Route Optimization
Planning route efficiently is essential in fleet logistics. This is because poor route selection results in more fuel consumption, increased operational costs and delivery delays. Data visualization enables managers to:
- Analyze routes: On the basis of delivery points and traffic patterns, visual tools provide efficient route guidance.
- Identify bottlenecks: Color-coded routes and heat maps identify and highlight the jammed areas to alert users to avoid delays and encourage adjustments.
- Predictive analysis: You can predict the traffic trends and weather conditions via such analysis, as you get access to insights related to potential disruptions
This results in:
- Less fuel consumption.
- Increased customer satisfaction due to timely deliveries.
- Lower operational costs and reduced delivery time
3. Fleet Performance and Utilization
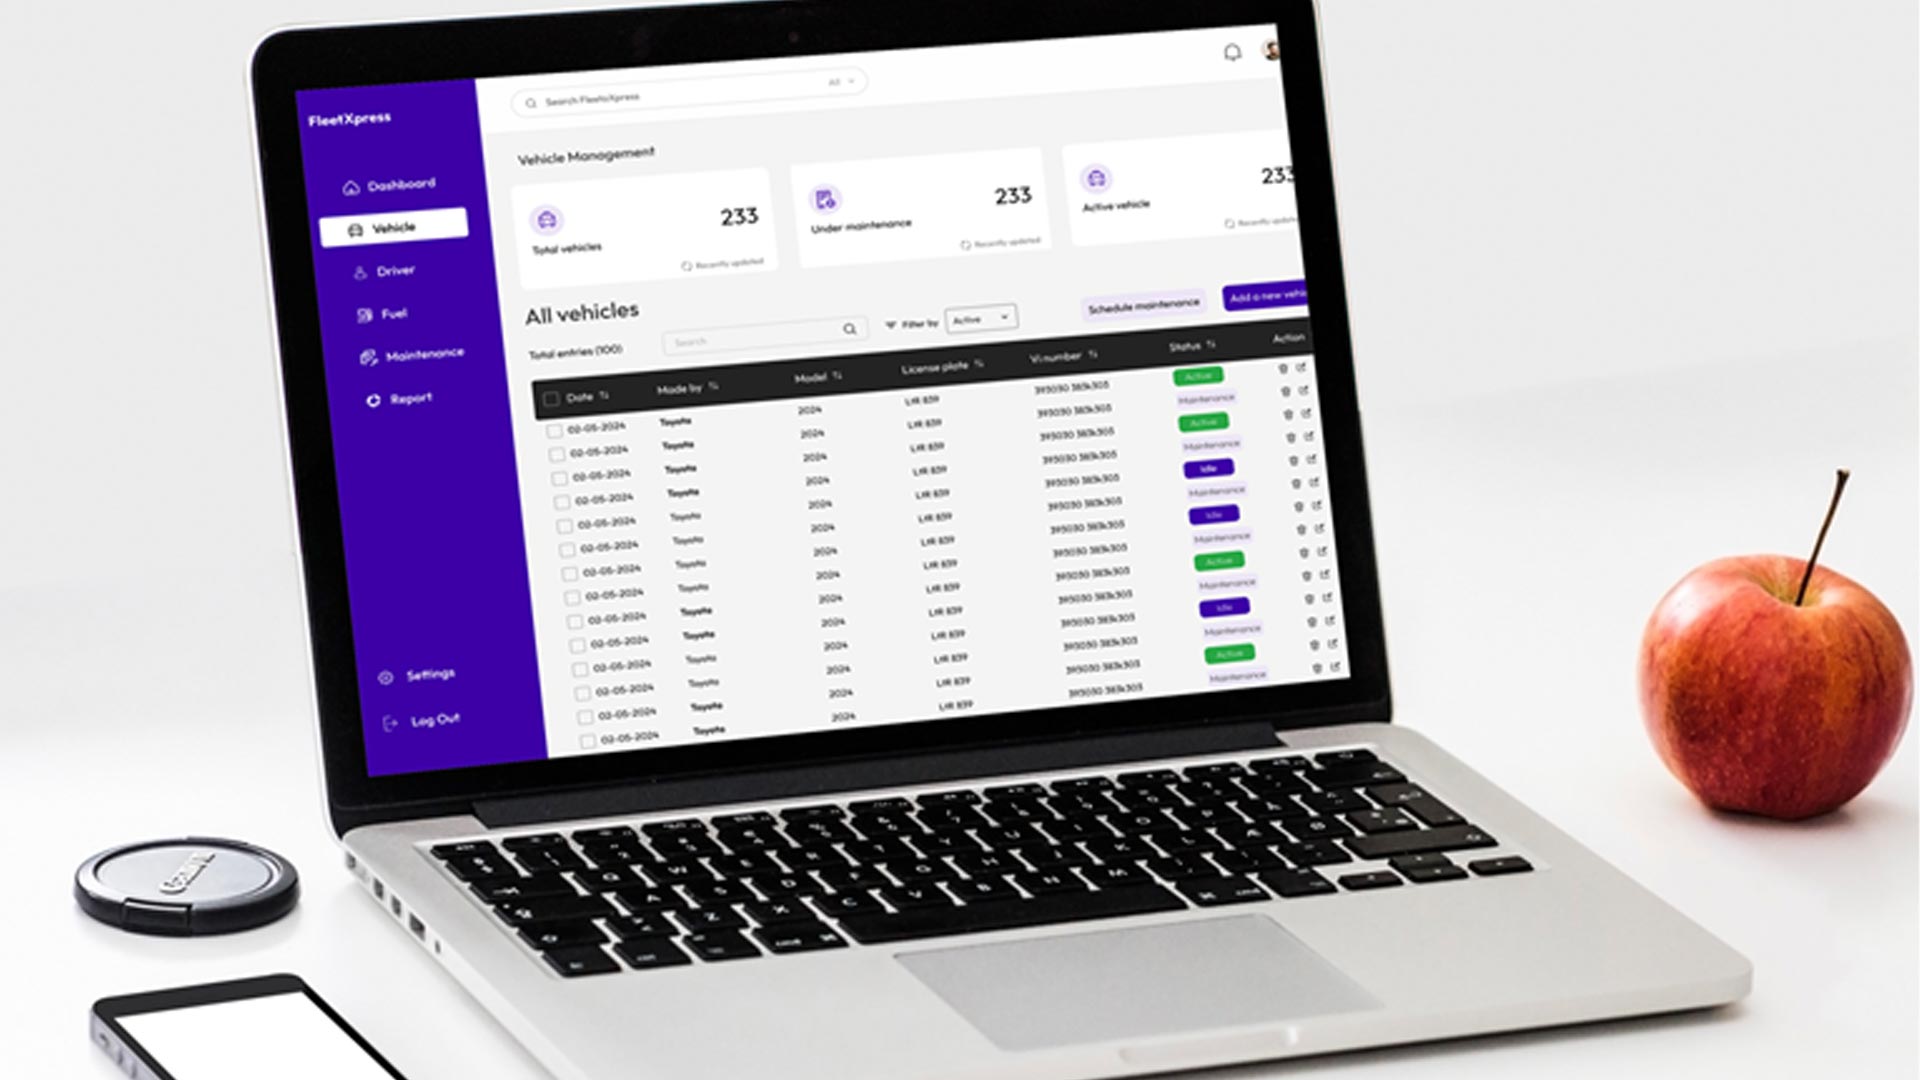
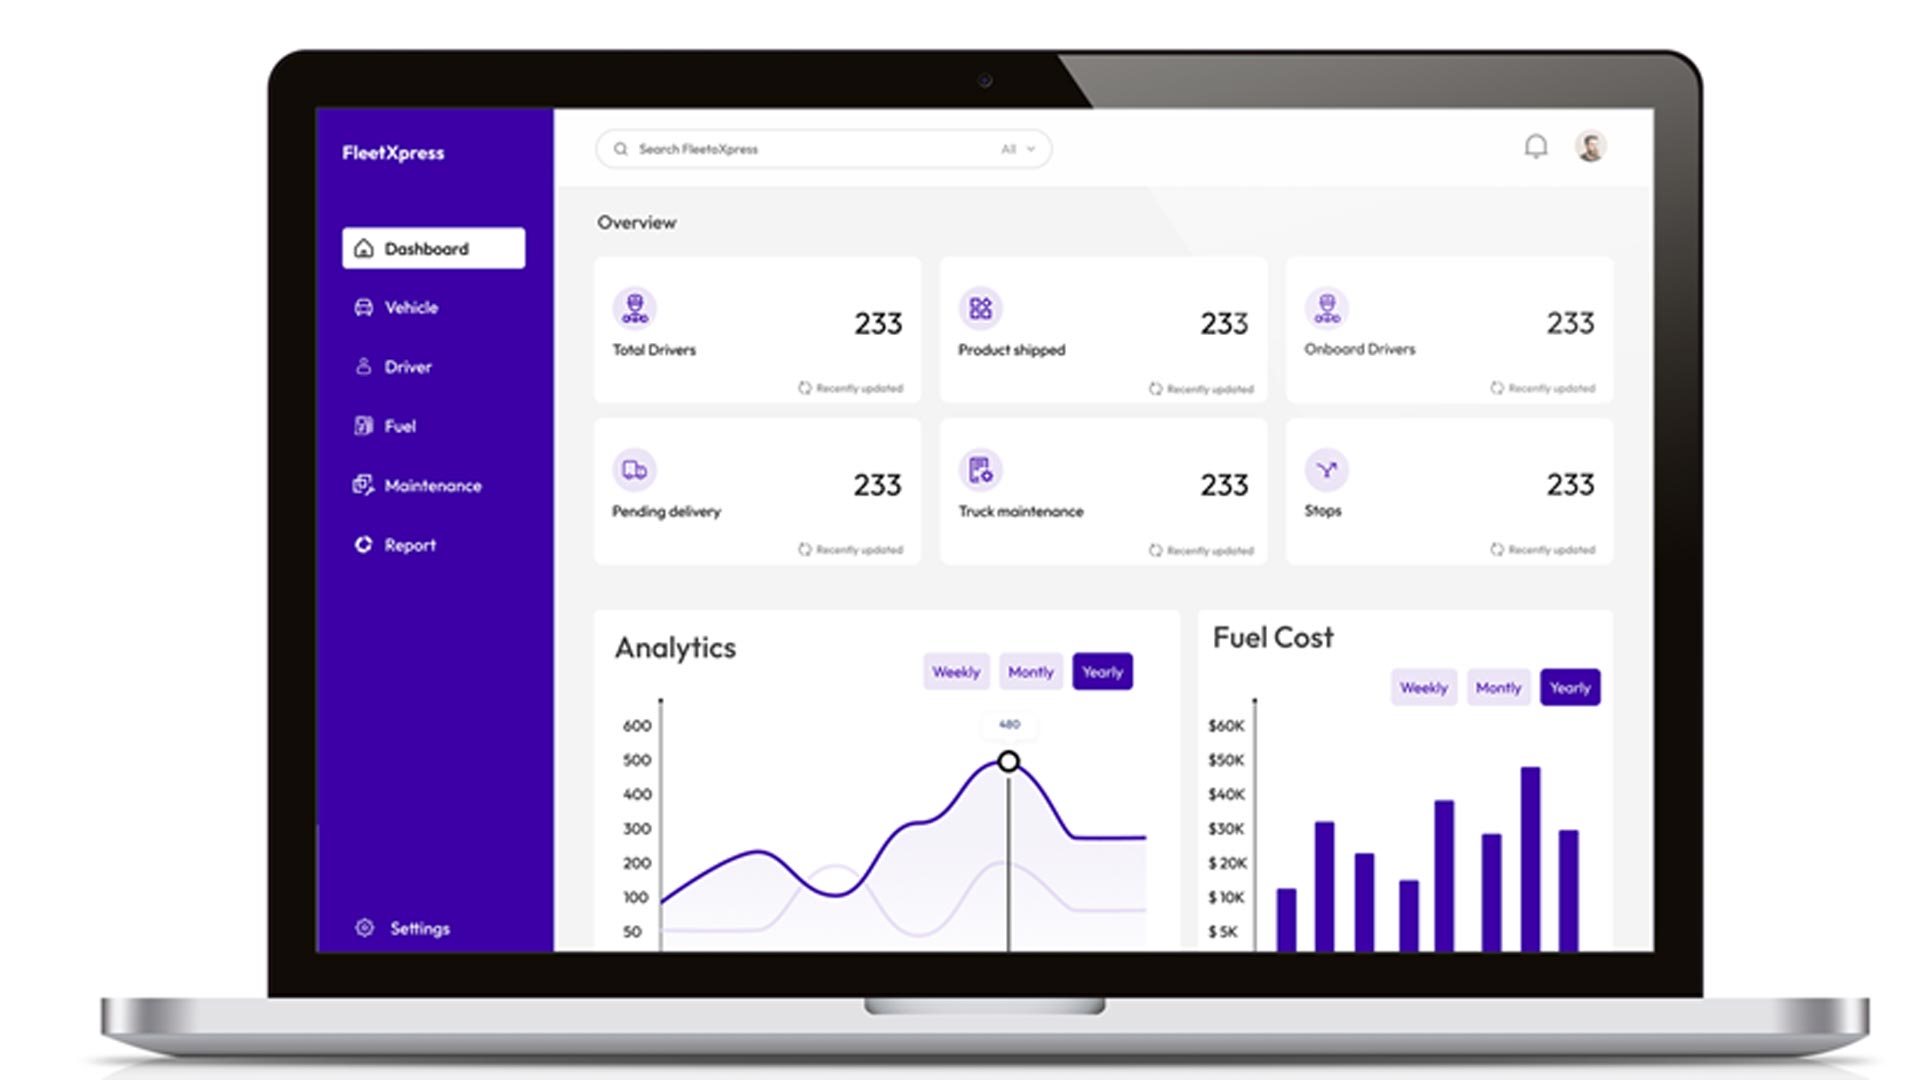
Data visualization assists in providing a précised overview of fleet performance metrics like maintenance schedules, vehicle utilization rates, fuel efficiency and productivity.
- Utilization reports: Visual dashboards provide data on vehicles that are being used, underutilized etc., enabling better resource allocation and fleet optimization.
- Fuel efficiency: Charts and graphs are provided of fuel consumption trends, enabling fleet managers to cater to fuel wastage and enhance efficiency
This results in:
- Reduced downtime and proactive maintenanc.
- Better fuel economy.
- Optimized fleet size and vehicle use.
4. Cost Analysis and Budget Management
Through data visualization, fleet managers can easily monitor and track the costs linked with fleet operations.Expenses like maintenance, fuel and driver wages are represented so that managers can:
- Identify cost drivers: Reports highlight the segments where cost is increasing, enabling quick interventions.
- Compare costs: Bar or line charts can provide cost comparison over time between several routes and vehicles.
This results in:
- Improved financial forecasting and planning.
- High ROI on fleet investments.
- Low or no unnecessary spending.
5. Driver Performance and Safety Monitoring
Efficient and safe driving is critical in fleet management. Data visualization tools help fleet managers to:
- Track driver behavior: Dashboards provides critical metrics like over speeding, harsh braking and accelerating, which shows a form of risky driving.
This results in:
- Improved driver training and acknowledgement of better performers.
- Low number of accidents and reduced insurance costs.
- Continuous monitoring promoting driver safety.
6. Inventory and Load Management
Fleet logistics isn’t about vehicles management but also caters to goods management that are being transported.Data visualization role in this case is to assist in:
- Tracking cargo: Visual dashboard to display in transit inventory status, to ensure deliveries are following the track assigned.
- Capacity utilization: Heatmaps and bar charts indicating the way vehicle load capacity is utilized, so that vehicles do not run below full capacity.
- Inventory flow: Flowcharts visualize the goods movement from warehouse to customer, indicating any delay or inefficiencies that may occur in the supply chain.
This results in:
- Improved delivery accuracy and better inventory flow.
- Less discrepancies in the deliveries.
- Optimized vehicle loads leading to low fuel consumption.
7. Customer Experience and Satisfaction
Just like every other place, in fleet management too customer experience is crucial. Fleet managers can work on improving customer experience by assisting customers with real-time insights on the delivery progress via data visualization tools:
- Delivery tracking: Providing customer with immediate update about their shipment’s status and location, improving transparency.
- Delivery performance: Visual reports display on-time delivery price rates, providing clients with reliable details.
- Customer feedback: Charts and heatmaps combine customer feedback about deliveries to assist fleet managers in dealing with common issues that occur and ultimately improving service quality.
This results in:
- Greater service quality and reliability.
- Rapid resolution of delivery problems.
- Improved customer satisfaction and communication.
Data visualization is transforming complicated fleet data into simple insights, enabling the fleet managers to reduce operational costs, optimize routes, better driver safety measures leading to an improved fleet performance. With the help of predictive analytics, real time dashboards, and visually appealing maps, fleet managers cater operations and make well-informed decisions that results in cost savings and greater efficiency.With the help of data visualization tools in fleet logistics, businesses can have a competitive edge, better allocation of resources and service delivery their resources.